How to produce a Txy isothermal VLE diagram with LIBPF ?
Instantiate components:
components.addcomp(new purecomps::water); // 0
components.addcomp(new purecomps::EthyleneGlycol("MEG")); // 1
components.addcomp(new purecomps::DiethyleneGlycol("DEG")); // 2
components.addcomp(new purecomps::TriethyleneGlycol("TEG")); // 3
Instantiate and setup the stream object:
StreamNrtl1LiquidVapor s;
s.S("flowoption") = "Nw";
s.S("flashoption") = "PA";
s.Q("P") = Value(101325.0, "Pa");
s.Q("Tphase.w", "H2O") = Zero;
s.Q("Tphase.w", "MEG") = Zero;
s.Q("Tphase.w", "DEG") = Zero;
s.Q("Tphase.w", "TEG") = Zero;
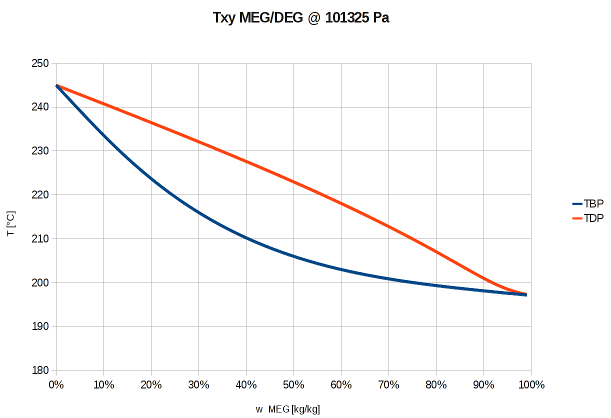
Loop over a composition range (in this case mass-based) and calculate dew and bubble point temperatures
for (Value x=Zero; x<=One; x += 0.01) {
  s.Q("Tphase.w", "MEG") = x;
  s.Q("Tphase.w", "DEG") = One - x;
  s.Q("Vphase.fraction") = Zero;
  s.calculate();
  Value TBP = s.Q("T");
  s.Q("Vphase.fraction") = One;
  s.calculate();
  Value TDP = s.Q("T");
  std::cout << x .toDouble() << " " << TBP.toDouble() << " " << TDP.toDouble() << std::endl;
}
What you get is a table of values; use your preferred plotting tool to create a plot like this one: