Sieve tray flooding correlation
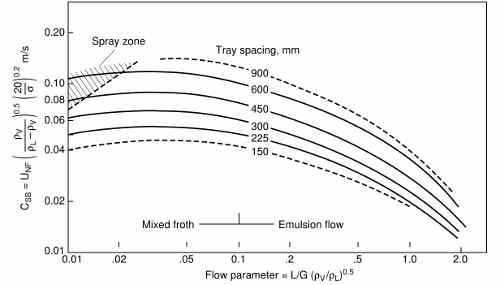
The correlation of Fair, J. R., “How to Predict Sieve Tray Entrainment and Flooding” Petro/chem. Engr., 33 (10), pp. 45–62 (1961) also cited in Perry, Chemical Engineers Handbook 7th ed. page 14-27 can be used to predict the flooding limit in sieve trays.
The correlation is presented in the form of a plot, which makes its application in a computer system unpractical:
 In Perry cit. an analytical expression for these curves is quoted from Lygeros and Magoulas, Hydrocarbon Proc. 65(12), 43 (1986), but the fit is not accurate; also the derivative of the capacity parameter w.r.t. the flow parameter, which in the plot is positive at low values of the latter, when computed with the analytical expression is negative.
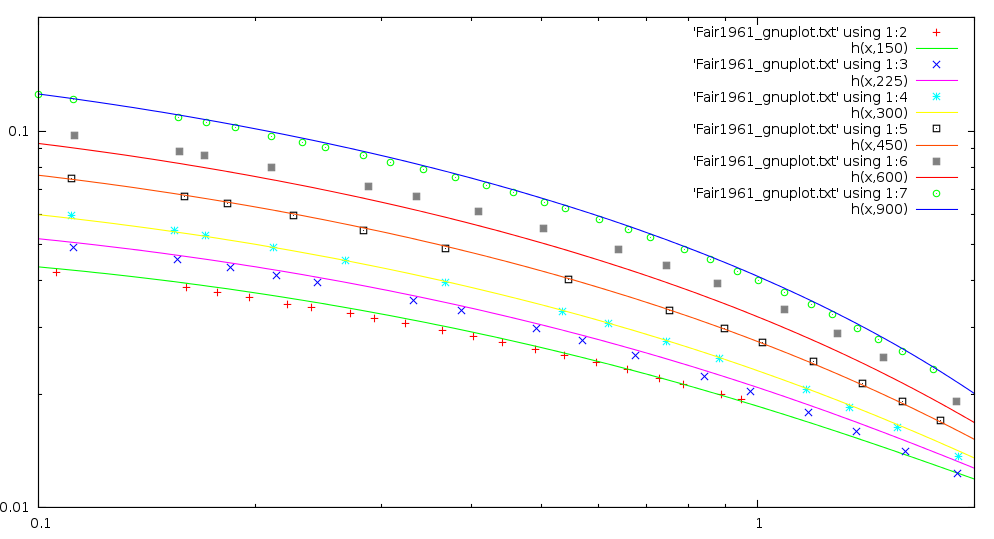
The Fair plot can be digitized using the excellent utility ScanIt. The resulting digitized plot can be fitted using gnuplot to this expression:
h(x,y) = (((a1*y+a2)*log(x) + (b1*y+b2))*log(x) + (c1*y+c2))*log(x) + (d1*y+d2)
which returns the capacity parameter (m/s) if it is supplied x, the flow parameter (adimensional) and y, the tray spacing (mm). Log is the natural logarithm.
The numerical values for the coefficients are:
| a1 | 1.10748e-06 |
| a2 | 0.00045284 |
| b1 | 4.04865e-06 |
| b2 | 0.000799395 |
| c1 | -3.09381e-05 |
| c2 | -0.00625024 |
| d1 | 3.00232e-05 |
| d2 | 0.0140453 |
The expression is smooth and reproduces the original plot both qualitatively and quantitatively:
The deviation in term of graph abscissa are on average 2.9% on all the sampled points (384). The curve at tray spacing = 600 mm has a marger error (7.1%); if that curve is excluded, the average error on the remaining 330 sample points is 2.2%.
